
Reports
Understand how your business is doing — revenue, bookings and trends over time.
What you can do here
- See revenue, bookings and average spend for any date range
- Compare services, team members and days of the week
- See where your bookings are coming from
- Track product sales and gross profit
- Export any report as a CSV
What's on this screen
The date range
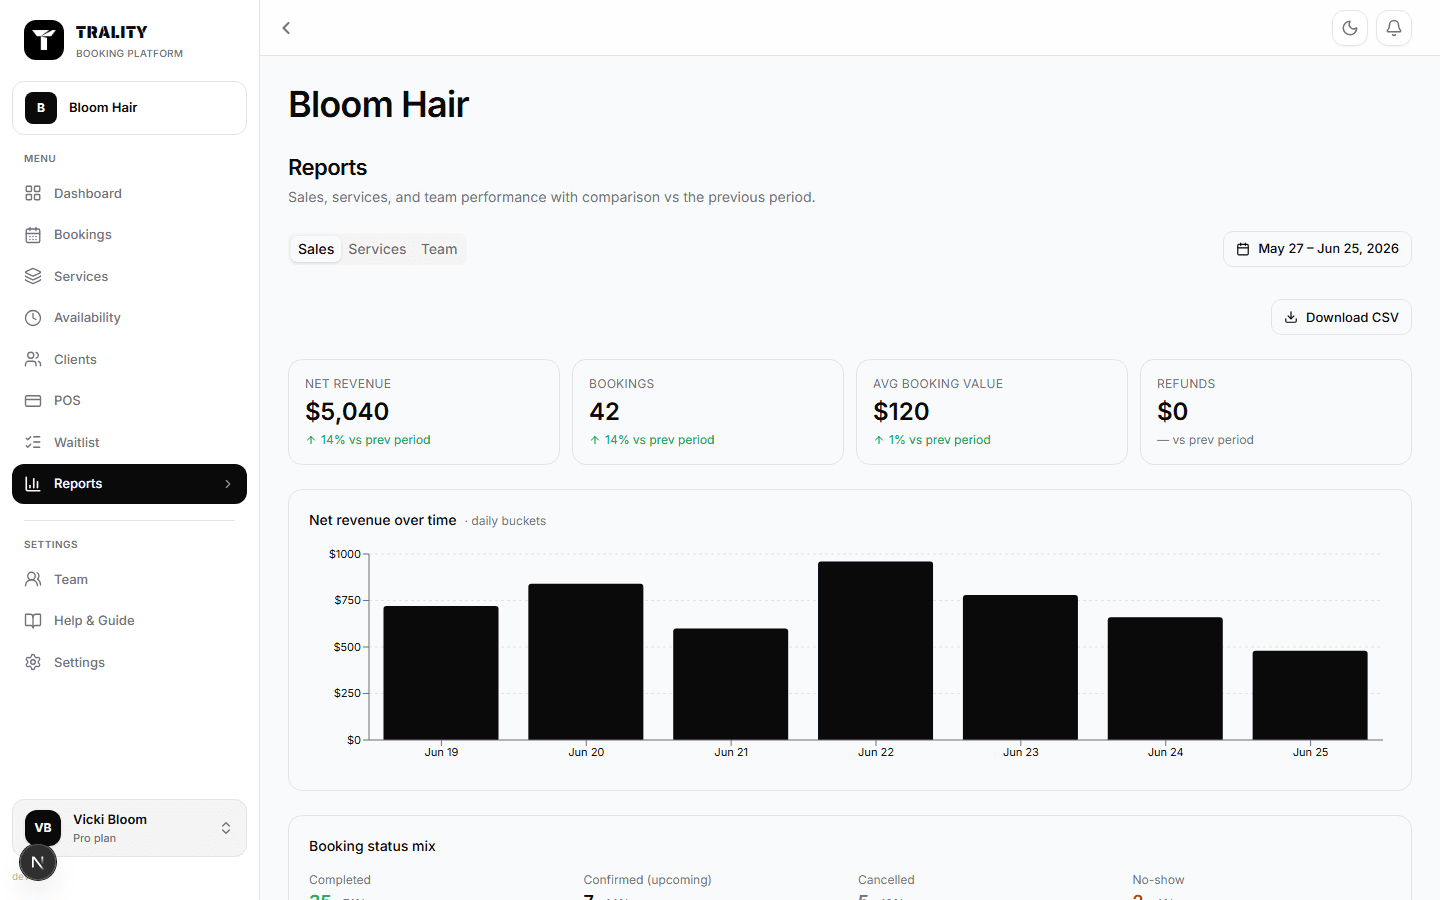
Every tab reads from the range picked at the top, and figures compare against the previous period of the same length — so a jump or a dip has something to sit against rather than floating on its own.
Sales
Money received across bookings and the POS, drawn over time, with the number of transactions and the average sale behind it. Revenue means money in, not the value of what's in the diary.
Services
Which services earned the most and which were booked the most — rarely the same list. A service near the top for volume and near the bottom for revenue is usually one to reprice.
Team
Takings per person and how much of their rostered time was booked. This is the honest read on whether the roster matches demand, rather than who looks busy.
Sources
Where bookings came from — your booking page, a QR code, a tagged social link, walk-ins. This is what the Promote page's tagged links feed.
Products
Units sold, revenue, and gross profit — the gap between retail and the cost price on each product. Products with no cost price recorded will overstate profit here.
Export
Each report downloads as a CSV over the same date range, for your accountant or your own spreadsheet.
